In the 1930s, Ralph Nelson Elliott found that markets move in predictable wave-like patterns. He called this the Elliott Wave Theory.
A full Elliott Wave cycle has two parts:
- Five waves going in the direction of the main trend.
- Three waves going against the main trend (a correction).
Crypto traders use this pattern to see if a market rise or fall is temporary or the start of a bigger trend. By knowing where they are in this cycle, traders can identify important turning points, helping them decide when to enter or exit trades.
What is the Elliott Wave Theory?
Elliott Wave Theory is a tool traders use to predict market trends by studying repeated patterns tied to investor behavior.
The theory works by examining two key elements:
- Price chart patterns: Recognizing recurring shapes on charts.
- Market psychology: Understanding how traders feel at market highs and lows.
When used correctly, Elliott Wave Theory helps traders clearly understand market cycles, anticipate future price movements, and make better trading decisions.
The Basic Elliott Wave Pattern
Ralph Nelson Elliott discovered that market prices often move in recognizable patterns. These patterns repeat themselves regularly but can vary in size and timing.
Elliott believed that human emotions and social behaviors directly influence these patterns in the market. He named these price movements “waves.”
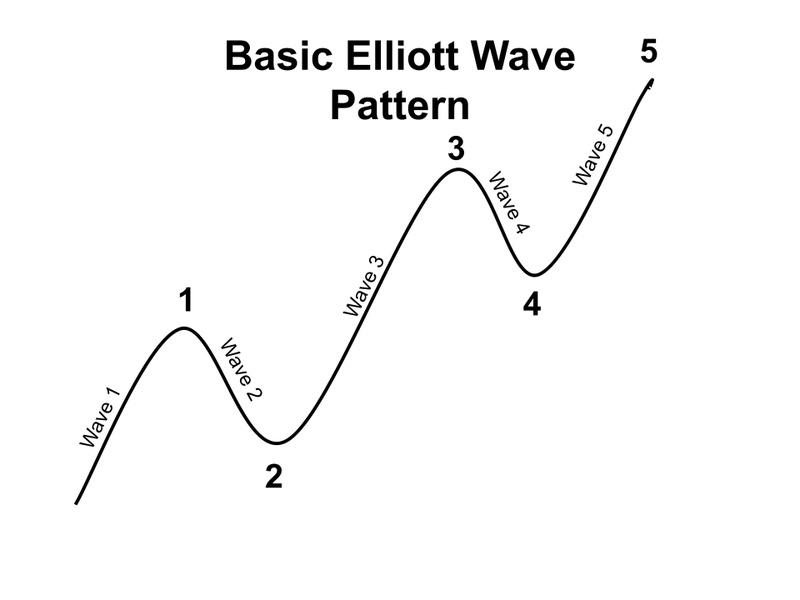
In the image above, we have the basic Elliott Wave pattern. Each mini-trend is called a wave. as you can see Wave 1-5
The basic Elliott Wave pattern consists of five waves labeled 1 through 5. Each wave represents a smaller trend within the bigger picture:
- Waves 1, 3, and 5 move in the direction of the main trend.
- Waves 2 and 4 are corrections that move against the main trend.
By recognizing these waves clearly, traders can better understand market trends and make smarter trading decisions.
Elliott Wave Price Cycle
A full Elliott Wave cycle has two main parts:
- Motive phase – moves in the direction of the trend (labeled with numbers).
- Corrective phase – moves against the trend (labeled with letters).
Together, these form an eight-wave cycle:
Five motive waves (1–5) followed by three corrective waves (A–B–C).
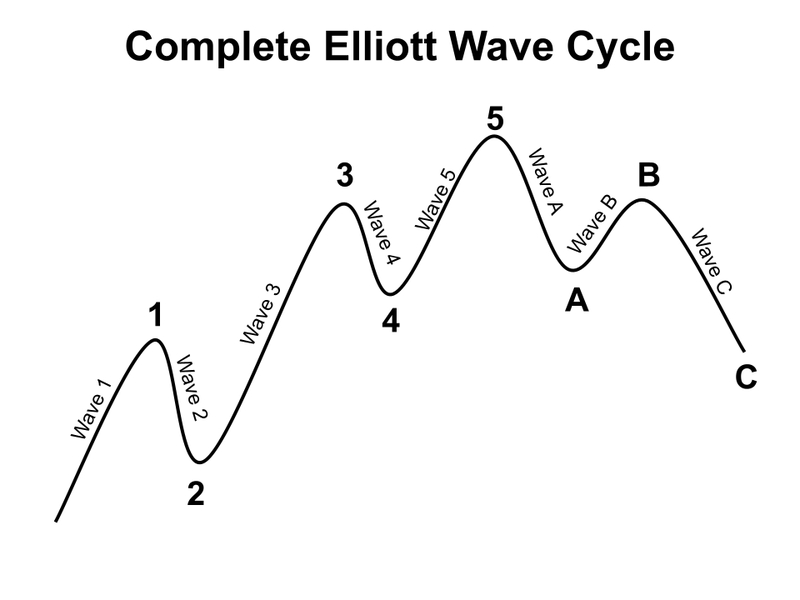
This 8-wave cycle is the core structure in Elliott Wave Theory, and it repeats in larger and smaller patterns across all timeframes.
Spotting the Crypto Trends
Elliott Wave patterns show up in all major markets—and crypto is no exception.
Because crypto trading is heavily influenced by emotions and crowd behavior, it’s a perfect match for Elliott Wave analysis. With just a basic understanding of the theory, traders can start spotting trends in Bitcoin, Ethereum, and other cryptocurrencies.
As mentioned earlier, Elliott identified two repeating phases in the market:
- Motive waves (moving with the trend)
- Corrective waves (moving against it)
These phases repeat across all timeframes, big or small, because the market moves in fractals—meaning the same patterns appear at different scales. The key is knowing which wave “degree” you’re looking at to understand the bigger picture.
Motive and Corrective Waves
Crypto markets move in two main phases: motive and corrective.
With a bit of practice, you can spot these phases on a price chart:
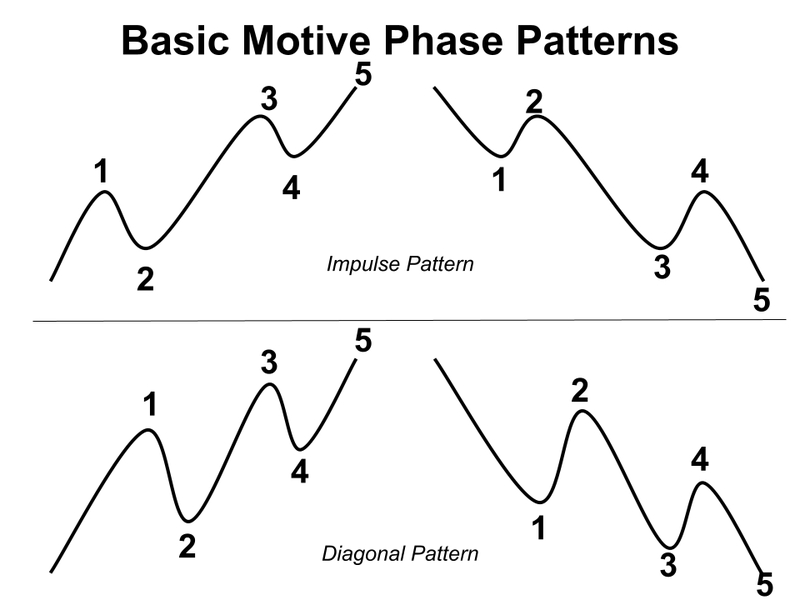
- Motive waves push the market in one clear direction. They often come with strong momentum and are made up of five smaller waves inside.
- Within motive waves, there are two common patterns:
- Impulse waves – fast, clean moves in the trend’s direction.
- Diagonal waves – similar in direction but appear more like a wedge or slanted channel.
Impulse, Diagonal & Corrective Patterns
Among the two motive wave types, the impulse wave is the one you’ll see most often. Within this pattern, Waves 2 and 4 are actually small corrections—each with its own unique shape.
When the market enters a corrective phase, it usually forms one of three basic patterns:
- Zigzag
- Flat
- Triangle
These patterns act like a “pause,” giving the market time to cool off before continuing the trend. Some key things to know about corrective waves:
- They’re often made of three smaller waves, which is why they’re called “threes.”
- They typically pull back partway into the previous motive wave, rather than fully reversing it.
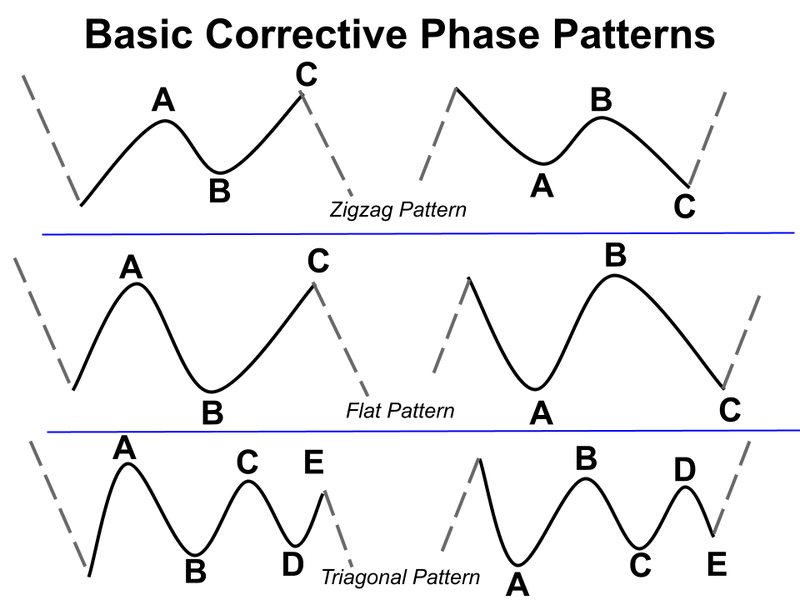
The flat, triagonal, and zigzag pattern.
It’s not always easy to spot the exact corrective pattern while it’s happening. Instead of stressing about the details, start by asking one simple question:
Is the market in a motive phase or a corrective phase?
Once you can recognize that, identifying patterns like flats, triangles, or zigzags becomes much easier with time and experience.
Trends vs. Consolidation in Elliott Waves
In Elliott Wave Theory, you can tell whether the market is trending or correcting just by looking at how the waves are labeled:
Corrective waves are marked with letters (like a, b, c…).
Trend waves are marked with numbers or Roman numerals (like i, ii, iii…).

In the chart above, you can see how each phase is labeled. The numbered waves (i, ii, iii, iv, v) show the main upward trend, while the lettered waves (a, b, c, d, e) represent the consolidation or pullback phases in between.
By learning to spot these labels, you’ll quickly understand whether the market is moving forward or just taking a breather before the next big move.
Estimating How Deep Corrections Go
One of the most useful parts of Elliott Wave Theory is how it shows a natural rhythm in price movement. Each wave tends to follow certain rules—and this includes how deep corrective waves go during a trend.
In an impulse (5-wave trend), Wave 2 and Wave 4 are the two main pullbacks. But they behave differently.
Let’s focus on Wave 2 first:
- Wave 2 usually pulls back around 62% of Wave 1’s move.
- Sometimes it’s shallower (around 38%) or deeper (up to 78%), but it almost always stays above the 100% mark—meaning it shouldn’t fully erase Wave 1.
- A retracement of more than 23% is considered significant.
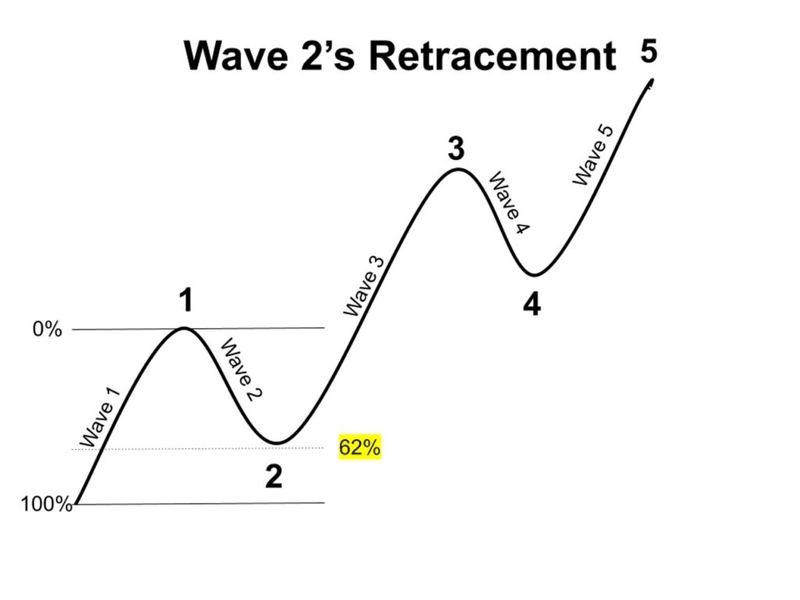
Using a Fibonacci retracement tool, traders can measure how far Wave 2 might fall before the trend continues. This helps in spotting entry points during corrections.
As shown in the image above, Wave 2 typically retraces to around 62% of Wave 1, which is a common target in Elliott Wave analysis.
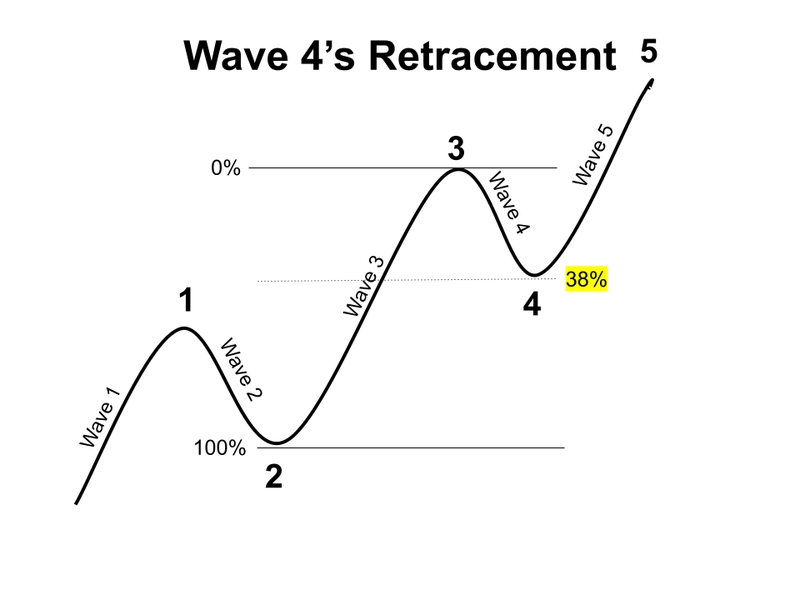
Example of Elliott wave 4 retracement pattern.
Once Waves 1, 2, and 3 of an impulse are complete, the market usually enters a short pause or pullback—this is Wave 4.
If Wave 3 is longer than Wave 1 (which is common), then Wave 4 often retraces about 38% of Wave 3’s move.
This retracement isn’t random—it follows a common pattern, and traders use tools like Fibonacci levels to estimate where Wave 4 might end. Spotting this can help you time your entries more accurately, getting in just before the next wave (Wave 5) kicks off.
Ethereum’s 5-Wave Pattern in Action (Usecase)
In early 2021, Ethereum formed a clear five-wave impulse, giving a real-world example of how Elliott Wave Theory plays out.
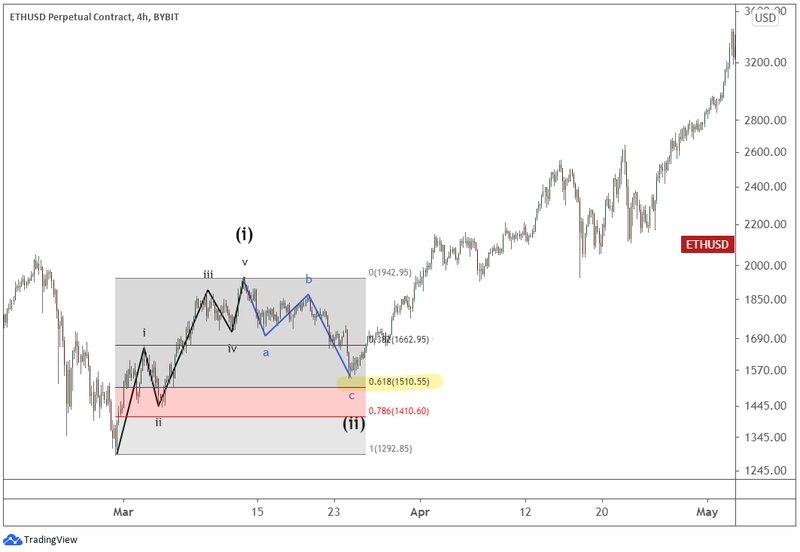
Example of Ethereum’s five-wave impulse pattern.
Wave (i) and Wave (ii):
- Wave (i) was a full impulse move upward.
- Then came Wave (ii)—a zigzag correction that retraced about 62% of Wave (i), which is typical for a second wave.
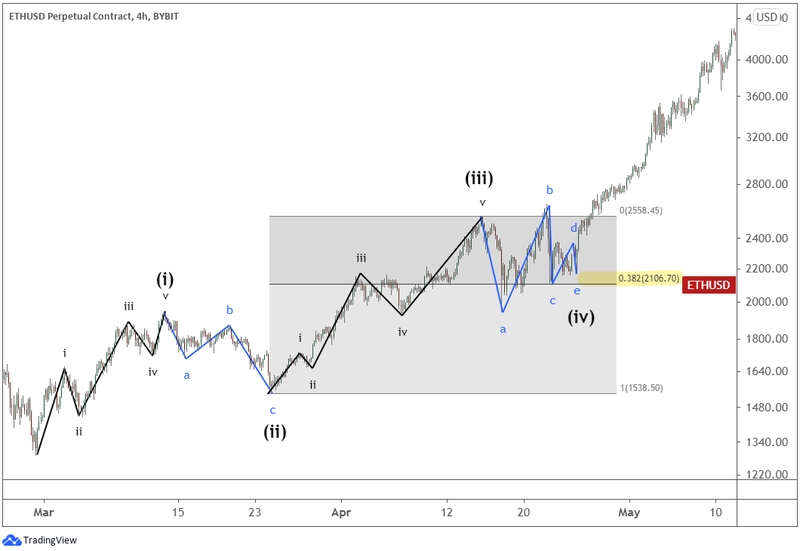
Example of Ethereum’s subwaves of the five-wave impulse pattern.
Wave (iii):
- Ethereum surged again in Wave (iii), making a strong rally to new highs.
- Inside Wave (iii), you can even spot its own five smaller subwaves—showing how Elliott Waves repeat within themselves (this is called a fractal structure).
Wave (iv)
- After the rally, the market entered Wave (iv), a sideways pullback.
- This wave retraced about 38% of Wave (iii), again aligning with classic Elliott Wave expectations.
- The correction formed a triangle pattern, which often appears during Wave 4.
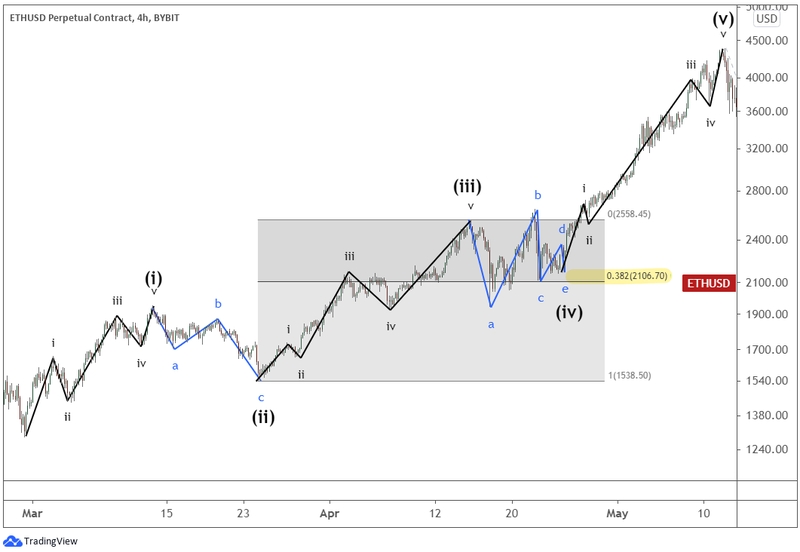
The complete of Ethereum’s a larger Elliott Wave impulse pattern.
Wave (v) — The Final Push:
- Finally, Ethereum pushed higher in Wave (v) to complete the full impulse cycle.
Best Entry & Exit Points using Elliott Wave Theory
When you look at the full eight-wave cycle, some waves stand out as better opportunities to trade than others—offering more reward with less risk.
Top Entry Zones:
- After Wave 2 ends → Entering Wave 3
Wave 3 is usually the strongest and longest, making it a great opportunity for big gains. - After Wave 4 ends → Entering Wave 5
This can be another solid entry point with decent profit potential.
Opportunities During Corrections:
- If you’re watching a larger timeframe, like a weekly chart, you might also trade:
- Wave A (start of the correction)
- Wave C (end of the correction move)
These corrective waves aren’t ideal for short-term trades, but on bigger charts, they can offer strong moves worth targeting.
In short, focus on:
- Trading Wave 3 for momentum
- Catching Wave 5 for trend continuation
- Watching Waves A and C on higher timeframes for reversal plays
Elliott Waves & Fibonacci: A Perfect Match
Elliott Wave Theory and Fibonacci tools work hand in hand. That’s because the wave structure in Elliott’s model (5 trend waves + 3 corrective waves) follows the Fibonacci number sequence.
Traders often use two main Fibonacci tools with Elliott Waves:
- Fibonacci Retracement – to measure how far a wave pulls back.
- Fibonacci Extension – to predict how far a wave might travel.
Some common patterns:
- Wave 2 usually retraces around 61.8% of Wave 1.
- Wave 4 often retraces 38.2% of Wave 3.
When used correctly, Fibonacci levels help traders spot potential reversal zones and map out wave counts—giving them a clearer view of where the market might go next.
Is Elliott Wave Theory Reliable?
Yes, but only if you know how to use it.
Elliott Wave Theory can offer deep insight into market behavior. Experienced analysts often say it helps them understand the market’s rhythm and spot trend changes. But for beginners, it might feel too complex or subjective at first.
Think of it like this:
A stick of dynamite in the hands of a child is dangerous.
In the hands of an expert, it can carve tunnels through mountains.
Elliott Wave isn’t a shortcut, it’s a skill that takes time and practice. But once mastered, it gives traders a powerful tool to anticipate market moves more consistently.